Direct Line 650.455.4545     Email OrlandoGuillory@gmail.com     License: Cal BRE# 01912949
Orlando Guillory

Orlando Guillory

Integrity, Knowledge and Commitment...for Superior Results!

Daly City
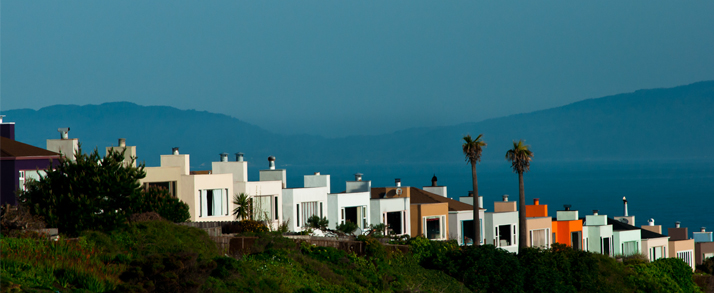
A green-belt community of beautiful historic cemeteries and agricultural gardens, the unique town of Colma encircles a thriving regionally oriented commercial area. The abundance of cemeteries dates back to the turn of the century, when San Francisco’s land scarcity prompted the city to look elsewhere for interments — namely, San Mateo County. Over the decades, businesses and residential developments emerged to form a charming community and modern city infrastructure nestled in the gently rolling hills of the Peninsula.

Newcomers will find in Colma a pleasing combination of small-town amenities and services, including restaurants, one of Northern California’s largest auto dealerships, shopping districts, a movie theater, and a first-rate outlet center filled with discounted name-brand merchandise. The expanded amenities in neighboring Daly City make life in this intimate community even more convenient and appealing. The two communities even share a chamber of commerce.

'Original' Daly City (30-day trend)
 
Number of Properties
Avg Price
Avg $/SQFT
Avg DOM
% of Avg Sold Price/Avg List Price
Active
8 (Number of Properties)
$1,056,538 (Avg Price)
$670 (Avg $/SQFT)
26 (Avg DOM)
Sold
0 (Number of Properties)
$1,096,486 (Avg Price)
$939 (Avg $/SQFT)
53 (Avg DOM)
100% (% of Avg Sold Price/Avg List Price)
Blossom Valley (30-day trend)
 
Number of Properties
Avg Price
Avg $/SQFT
Avg DOM
% of Avg Sold Price/Avg List Price
Active
1 (Number of Properties)
$1,198,000 (Avg Price)
$843 (Avg $/SQFT)
1 (Avg DOM)
Sold
1 (Number of Properties)
$1,250,000 (Avg Price)
$851 (Avg $/SQFT)
31 (Avg DOM)
113% (% of Avg Sold Price/Avg List Price)
Broadmoor (30-day trend)
 
Number of Properties
Avg Price
Avg $/SQFT
Avg DOM
% of Avg Sold Price/Avg List Price
Active
0 (Number of Properties)
$1,178,000 (Avg Price)
$996 (Avg $/SQFT)
10 (Avg DOM)
Sold
0 (Number of Properties)
$0 (Avg Price)
$0 (Avg $/SQFT)
0 (Avg DOM)
0% (% of Avg Sold Price/Avg List Price)
Crown Colony (30-day trend)
 
Number of Properties
Avg Price
Avg $/SQFT
Avg DOM
% of Avg Sold Price/Avg List Price
Active
2 (Number of Properties)
$826,370 (Avg Price)
$763 (Avg $/SQFT)
38 (Avg DOM)
Sold
1 (Number of Properties)
$983,555 (Avg Price)
$783 (Avg $/SQFT)
30 (Avg DOM)
102% (% of Avg Sold Price/Avg List Price)
Serramonte (30-day trend)
 
Number of Properties
Avg Price
Avg $/SQFT
Avg DOM
% of Avg Sold Price/Avg List Price
Active
0 (Number of Properties)
$1,128,000 (Avg Price)
$932 (Avg $/SQFT)
4 (Avg DOM)
Sold
4 (Number of Properties)
$1,268,511 (Avg Price)
$882 (Avg $/SQFT)
35 (Avg DOM)
117% (% of Avg Sold Price/Avg List Price)
Southern Hills (30-day trend)
 
Number of Properties
Avg Price
Avg $/SQFT
Avg DOM
% of Avg Sold Price/Avg List Price
Active
1 (Number of Properties)
$981,752 (Avg Price)
$936 (Avg $/SQFT)
3 (Avg DOM)
Sold
1 (Number of Properties)
$1,098,333 (Avg Price)
$680 (Avg $/SQFT)
79 (Avg DOM)
99% (% of Avg Sold Price/Avg List Price)
St. Francis Heights (30-day trend)
 
Number of Properties
Avg Price
Avg $/SQFT
Avg DOM
% of Avg Sold Price/Avg List Price
Active
2 (Number of Properties)
$652,610 (Avg Price)
$864 (Avg $/SQFT)
116 (Avg DOM)
Sold
0 (Number of Properties)
$1,050,000 (Avg Price)
$764 (Avg $/SQFT)
34 (Avg DOM)
117% (% of Avg Sold Price/Avg List Price)
Westlake #1 & Olympic (30-day trend)
 
Number of Properties
Avg Price
Avg $/SQFT
Avg DOM
% of Avg Sold Price/Avg List Price
Active
1 (Number of Properties)
$1,498,000 (Avg Price)
$930 (Avg $/SQFT)
3 (Avg DOM)
Sold
0 (Number of Properties)
$1,309,000 (Avg Price)
$1,072 (Avg $/SQFT)
40 (Avg DOM)
105% (% of Avg Sold Price/Avg List Price)
Westlake Heights (30-day trend)
 
Number of Properties
Avg Price
Avg $/SQFT
Avg DOM
% of Avg Sold Price/Avg List Price
Active
0 (Number of Properties)
$0 (Avg Price)
$0 (Avg $/SQFT)
0 (Avg DOM)
Sold
0 (Number of Properties)
$0 (Avg Price)
$0 (Avg $/SQFT)
0 (Avg DOM)
0% (% of Avg Sold Price/Avg List Price)
Westlake Highlands (30-day trend)
 
Number of Properties
Avg Price
Avg $/SQFT
Avg DOM
% of Avg Sold Price/Avg List Price
Active
1 (Number of Properties)
$1,348,000 (Avg Price)
$702 (Avg $/SQFT)
5 (Avg DOM)
Sold
0 (Number of Properties)
$1,261,487 (Avg Price)
$790 (Avg $/SQFT)
53 (Avg DOM)
120% (% of Avg Sold Price/Avg List Price)
Westlake Knolls (30-day trend)
 
Number of Properties
Avg Price
Avg $/SQFT
Avg DOM
% of Avg Sold Price/Avg List Price
Active
0 (Number of Properties)
$0 (Avg Price)
$0 (Avg $/SQFT)
0 (Avg DOM)
Sold
0 (Number of Properties)
$1,250,000 (Avg Price)
$976 (Avg $/SQFT)
18 (Avg DOM)
100% (% of Avg Sold Price/Avg List Price)
Westlake Palisades (30-day trend)
 
Number of Properties
Avg Price
Avg $/SQFT
Avg DOM
% of Avg Sold Price/Avg List Price
Active
0 (Number of Properties)
$1,099,000 (Avg Price)
$802 (Avg $/SQFT)
4 (Avg DOM)
Sold
3 (Number of Properties)
$1,383,684 (Avg Price)
$1,108 (Avg $/SQFT)
45 (Avg DOM)
121% (% of Avg Sold Price/Avg List Price)
Westlake Terrace (30-day trend)
 
Number of Properties
Avg Price
Avg $/SQFT
Avg DOM
% of Avg Sold Price/Avg List Price
Active
1 (Number of Properties)
$1,350,066 (Avg Price)
$916 (Avg $/SQFT)
17 (Avg DOM)
Sold
0 (Number of Properties)
$0 (Avg Price)
$0 (Avg $/SQFT)
0 (Avg DOM)
0% (% of Avg Sold Price/Avg List Price)

Property Info