Direct Line 650.455.4545     Email OrlandoGuillory@gmail.com     License: Cal BRE# 01912949
Orlando Guillory

Orlando Guillory

Integrity, Knowledge and Commitment...for Superior Results!

Redwood City

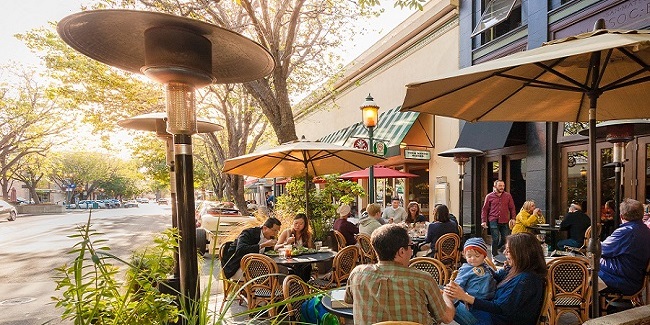
Located 25 miles south of San Francisco, the well-balanced community of Redwood City serves as the county seat and ranks among the most densely populated of San Mateo County’s urban centers. Incorporated in the mid 1860s, Redwood City is a long-established community that manages to harmonize residential, industrial, and commercial elements into a pleasing cityscape.

Its waterfront provides a yacht harbor and the only deep-water port in the South Bay, distinguished as the fastest-growing small bulk port in the state. In addition to its flourishing trade industry, the city is home to major medical centers and a number of leading corporations that include computer and Internet companies as “Silicon Valley” sprawls north. A well-developed and highly organized parks and recreation department oversees nearly two dozen parks and community centers that offer such facilities as sports fields, swimming pools, tennis courts, playgrounds, athletic leagues, fitness centers, and programs for all ages. Housing options in Redwood City range from vintage older homes to the most luxurious of new construction with superb Bay views.

Central Park Etc. (30-day trend)
 
Number of Properties
Avg Price
Avg $/SQFT
Avg DOM
% of Avg Sold Price/Avg List Price
Active
6 (Number of Properties)
$1,456,507 (Avg Price)
$1,073 (Avg $/SQFT)
52 (Avg DOM)
Sold
17 (Number of Properties)
$2,011,443 (Avg Price)
$1,209 (Avg $/SQFT)
38 (Avg DOM)
108% (% of Avg Sold Price/Avg List Price)
Clifford Heights Etc. (30-day trend)
 
Number of Properties
Avg Price
Avg $/SQFT
Avg DOM
% of Avg Sold Price/Avg List Price
Active
0 (Number of Properties)
$2,799,888 (Avg Price)
$982 (Avg $/SQFT)
10 (Avg DOM)
Sold
1 (Number of Properties)
$3,567,567 (Avg Price)
$1,173 (Avg $/SQFT)
27 (Avg DOM)
119% (% of Avg Sold Price/Avg List Price)
Cordilleras Heights Etc. (30-day trend)
 
Number of Properties
Avg Price
Avg $/SQFT
Avg DOM
% of Avg Sold Price/Avg List Price
Active
6 (Number of Properties)
$3,450,807 (Avg Price)
$977 (Avg $/SQFT)
51 (Avg DOM)
Sold
6 (Number of Properties)
$2,423,161 (Avg Price)
$1,205 (Avg $/SQFT)
36 (Avg DOM)
108% (% of Avg Sold Price/Avg List Price)
Dumbarton Etc. (30-day trend)
 
Number of Properties
Avg Price
Avg $/SQFT
Avg DOM
% of Avg Sold Price/Avg List Price
Active
8 (Number of Properties)
$1,713,804 (Avg Price)
$938 (Avg $/SQFT)
36 (Avg DOM)
Sold
4 (Number of Properties)
$1,360,298 (Avg Price)
$1,050 (Avg $/SQFT)
37 (Avg DOM)
108% (% of Avg Sold Price/Avg List Price)
Farm Hills Estates Etc. (30-day trend)
 
Number of Properties
Avg Price
Avg $/SQFT
Avg DOM
% of Avg Sold Price/Avg List Price
Active
4 (Number of Properties)
$3,001,838 (Avg Price)
$1,056 (Avg $/SQFT)
81 (Avg DOM)
Sold
6 (Number of Properties)
$1,861,792 (Avg Price)
$1,244 (Avg $/SQFT)
32 (Avg DOM)
108% (% of Avg Sold Price/Avg List Price)
High School Acres Etc. (30-day trend)
 
Number of Properties
Avg Price
Avg $/SQFT
Avg DOM
% of Avg Sold Price/Avg List Price
Active
9 (Number of Properties)
$2,944,768 (Avg Price)
$1,167 (Avg $/SQFT)
26 (Avg DOM)
Sold
7 (Number of Properties)
$2,566,573 (Avg Price)
$1,420 (Avg $/SQFT)
33 (Avg DOM)
106% (% of Avg Sold Price/Avg List Price)
Horgan Ranch Etc. (30-day trend)
 
Number of Properties
Avg Price
Avg $/SQFT
Avg DOM
% of Avg Sold Price/Avg List Price
Active
3 (Number of Properties)
$1,622,077 (Avg Price)
$988 (Avg $/SQFT)
21 (Avg DOM)
Sold
8 (Number of Properties)
$2,450,331 (Avg Price)
$1,324 (Avg $/SQFT)
25 (Avg DOM)
106% (% of Avg Sold Price/Avg List Price)
Lenolt Etc. (30-day trend)
 
Number of Properties
Avg Price
Avg $/SQFT
Avg DOM
% of Avg Sold Price/Avg List Price
Active
8 (Number of Properties)
$1,446,644 (Avg Price)
$998 (Avg $/SQFT)
23 (Avg DOM)
Sold
4 (Number of Properties)
$1,727,301 (Avg Price)
$1,272 (Avg $/SQFT)
32 (Avg DOM)
119% (% of Avg Sold Price/Avg List Price)

Property Info