Direct Line 650.455.4545     Email OrlandoGuillory@gmail.com     License: Cal BRE# 01912949
Orlando Guillory

Orlando Guillory

Integrity, Knowledge and Commitment...for Superior Results!

Pacifica

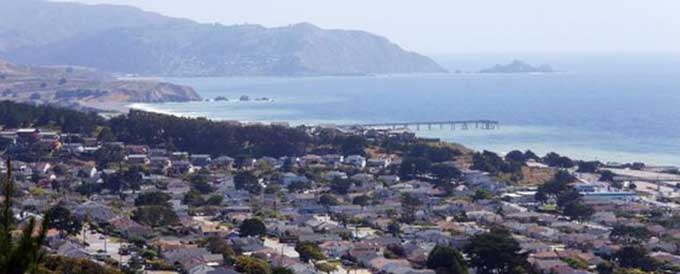
Stretching down the Pacific Coast, the City of Pacifica appears to bisect the seemingly endless sea with its spindly pier and jutting rocks of Piedro Point. Consisting of several small residential communities, the city is undeniably one of California’s most scenic coastline treasures. Just 15 minutes from San Francisco, the city has managed to retain its “island” atmosphere. Many homes are nestled along the verdant hillsides, offering spectacular views of golden sunsets over the glistening ocean.

The city’s business community is experiencing a boom, driven primarily by San Francisco businesses and executives who are seeking a tranquil haven at a distance from the rush of urban life. Consisting of several small residential communities and scattered single homes, the housing options range from modest single-family homes to a scattering of luxurious estates. Residents span all age groups, income levels, and career choices, drawn together by a closely knit community spirit and their mutual love of this oceanside paradise. The climate is often cool, subdued by morning mists that may linger throughout the day.

East Sharp Park (30-day trend)
 
Number of Properties
Avg Price
Avg $/SQFT
Avg DOM
% of Avg Sold Price/Avg List Price
Active
0 (Number of Properties)
$1,680,000 (Avg Price)
$652 (Avg $/SQFT)
22 (Avg DOM)
Sold
1 (Number of Properties)
$1,026,888 (Avg Price)
$1,031 (Avg $/SQFT)
44 (Avg DOM)
101% (% of Avg Sold Price/Avg List Price)
Pacific Manor (30-day trend)
 
Number of Properties
Avg Price
Avg $/SQFT
Avg DOM
% of Avg Sold Price/Avg List Price
Active
0 (Number of Properties)
$1,198,000 (Avg Price)
$1,222 (Avg $/SQFT)
19 (Avg DOM)
Sold
1 (Number of Properties)
$1,250,000 (Avg Price)
$1,666 (Avg $/SQFT)
19 (Avg DOM)
104% (% of Avg Sold Price/Avg List Price)
Pedro Point (30-day trend)
 
Number of Properties
Avg Price
Avg $/SQFT
Avg DOM
% of Avg Sold Price/Avg List Price
Active
1 (Number of Properties)
$2,900,000 (Avg Price)
$741 (Avg $/SQFT)
99 (Avg DOM)
Sold
0 (Number of Properties)
$0 (Avg Price)
$0 (Avg $/SQFT)
0 (Avg DOM)
0% (% of Avg Sold Price/Avg List Price)
Sun Valley (30-day trend)
 
Number of Properties
Avg Price
Avg $/SQFT
Avg DOM
% of Avg Sold Price/Avg List Price
Active
0 (Number of Properties)
$899,000 (Avg Price)
$642 (Avg $/SQFT)
2 (Avg DOM)
Sold
2 (Number of Properties)
$1,093,571 (Avg Price)
$838 (Avg $/SQFT)
32 (Avg DOM)
107% (% of Avg Sold Price/Avg List Price)
West Sharp Park (30-day trend)
 
Number of Properties
Avg Price
Avg $/SQFT
Avg DOM
% of Avg Sold Price/Avg List Price
Active
1 (Number of Properties)
$1,260,000 (Avg Price)
$768 (Avg $/SQFT)
6 (Avg DOM)
Sold
0 (Number of Properties)
$0 (Avg Price)
$0 (Avg $/SQFT)
0 (Avg DOM)
0% (% of Avg Sold Price/Avg List Price)
Fairmont (30-day trend)
 
Number of Properties
Avg Price
Avg $/SQFT
Avg DOM
% of Avg Sold Price/Avg List Price
Active
2 (Number of Properties)
$857,063 (Avg Price)
$648 (Avg $/SQFT)
64 (Avg DOM)
Sold
1 (Number of Properties)
$991,621 (Avg Price)
$683 (Avg $/SQFT)
95 (Avg DOM)
102% (% of Avg Sold Price/Avg List Price)
Linda Mar (30-day trend)
 
Number of Properties
Avg Price
Avg $/SQFT
Avg DOM
% of Avg Sold Price/Avg List Price
Active
7 (Number of Properties)
$1,955,056 (Avg Price)
$939 (Avg $/SQFT)
40 (Avg DOM)
Sold
3 (Number of Properties)
$1,133,998 (Avg Price)
$1,004 (Avg $/SQFT)
40 (Avg DOM)
105% (% of Avg Sold Price/Avg List Price)
Westview (30-day trend)
 
Number of Properties
Avg Price
Avg $/SQFT
Avg DOM
% of Avg Sold Price/Avg List Price
Active
2 (Number of Properties)
$1,243,374 (Avg Price)
$915 (Avg $/SQFT)
21 (Avg DOM)
Sold
2 (Number of Properties)
$1,291,409 (Avg Price)
$886 (Avg $/SQFT)
37 (Avg DOM)
107% (% of Avg Sold Price/Avg List Price)
Edgemar (30-day trend)
 
Number of Properties
Avg Price
Avg $/SQFT
Avg DOM
% of Avg Sold Price/Avg List Price
Active
1 (Number of Properties)
$1,375,000 (Avg Price)
$1,117 (Avg $/SQFT)
10 (Avg DOM)
Sold
0 (Number of Properties)
$0 (Avg Price)
$0 (Avg $/SQFT)
0 (Avg DOM)
0% (% of Avg Sold Price/Avg List Price)
Fairway Park (30-day trend)
 
Number of Properties
Avg Price
Avg $/SQFT
Avg DOM
% of Avg Sold Price/Avg List Price
Active
1 (Number of Properties)
$1,435,000 (Avg Price)
$829 (Avg $/SQFT)
6 (Avg DOM)
Sold
0 (Number of Properties)
$1,501,000 (Avg Price)
$1,000 (Avg $/SQFT)
29 (Avg DOM)
107% (% of Avg Sold Price/Avg List Price)
Park Pacifica (30-day trend)
 
Number of Properties
Avg Price
Avg $/SQFT
Avg DOM
% of Avg Sold Price/Avg List Price
Active
3 (Number of Properties)
$1,366,108 (Avg Price)
$885 (Avg $/SQFT)
15 (Avg DOM)
Sold
3 (Number of Properties)
$1,317,692 (Avg Price)
$918 (Avg $/SQFT)
51 (Avg DOM)
103% (% of Avg Sold Price/Avg List Price)
Rockaway Beach (30-day trend)
 
Number of Properties
Avg Price
Avg $/SQFT
Avg DOM
% of Avg Sold Price/Avg List Price
Active
0 (Number of Properties)
$0 (Avg Price)
$0 (Avg $/SQFT)
0 (Avg DOM)
Sold
1 (Number of Properties)
$1,610,000 (Avg Price)
$838 (Avg $/SQFT)
75 (Avg DOM)
96% (% of Avg Sold Price/Avg List Price)
Vallemar (30-day trend)
 
Number of Properties
Avg Price
Avg $/SQFT
Avg DOM
% of Avg Sold Price/Avg List Price
Active
4 (Number of Properties)
$2,110,278 (Avg Price)
$1,169 (Avg $/SQFT)
40 (Avg DOM)
Sold
0 (Number of Properties)
$0 (Avg Price)
$0 (Avg $/SQFT)
0 (Avg DOM)
0% (% of Avg Sold Price/Avg List Price)

Property Info