Direct Line 650.455.4545     Email OrlandoGuillory@gmail.com     License: Cal BRE# 01912949
Orlando Guillory

Orlando Guillory

Integrity, Knowledge and Commitment...for Superior Results!

Burlingame

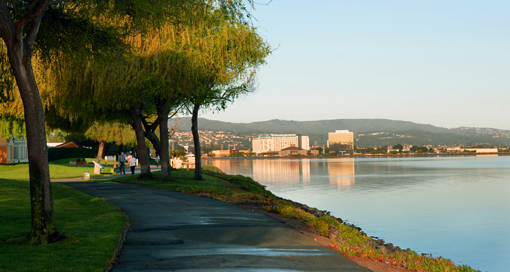
Dubbed the “City of Trees,” Burlingame recreational facilities, lush parks, and sweeping open spaces invite residents to take full advantage of the sun-drenched climate and year-round opportunities for outdoor activity. Nearby Bay, ocean, and mountain sites are appreciated by the many San Francisco commuters who have chosen the city as their residential haven.

Employment opportunities within the city continue to expand, mixing international enterprises, nationally known corporations, and independent businesses. Transportation advantages include the close proximity of San Francisco International Airport, Southern Pacific Railroad, and a major north/south artery.

A highly developed hospitality sector has opened the door for elegant hotels and conference facilities, inviting the proliferation of wonderful restaurants and shopping districts filled with boutiques and treasures. With its San Francisco Bay location, the city offers panoramic vistas of the Bay, the Burlingame hills, and the magnificent skyline of San Francisco.

Burlingame Downtown Area (30-day trend)
 
Number of Properties
Avg Price
Avg $/SQFT
Avg DOM
% of Avg Sold Price/Avg List Price
Active
3 (Number of Properties)
$1,496,543 (Avg Price)
$923 (Avg $/SQFT)
16 (Avg DOM)
Sold
1 (Number of Properties)
$1,290,625 (Avg Price)
$1,018 (Avg $/SQFT)
17 (Avg DOM)
105% (% of Avg Sold Price/Avg List Price)
Burlingame Gardens Etc. (30-day trend)
 
Number of Properties
Avg Price
Avg $/SQFT
Avg DOM
% of Avg Sold Price/Avg List Price
Active
1 (Number of Properties)
$2,339,000 (Avg Price)
$1,046 (Avg $/SQFT)
2 (Avg DOM)
Sold
0 (Number of Properties)
$0 (Avg Price)
$0 (Avg $/SQFT)
0 (Avg DOM)
0% (% of Avg Sold Price/Avg List Price)
Burlingame Gate/Burlingame Grove (30-day trend)
 
Number of Properties
Avg Price
Avg $/SQFT
Avg DOM
% of Avg Sold Price/Avg List Price
Active
0 (Number of Properties)
$2,298,000 (Avg Price)
$1,276 (Avg $/SQFT)
3 (Avg DOM)
Sold
4 (Number of Properties)
$2,111,144 (Avg Price)
$1,558 (Avg $/SQFT)
26 (Avg DOM)
118% (% of Avg Sold Price/Avg List Price)
Burlingame Hills / Skyline Terra (30-day trend)
 
Number of Properties
Avg Price
Avg $/SQFT
Avg DOM
% of Avg Sold Price/Avg List Price
Active
2 (Number of Properties)
$4,332,508 (Avg Price)
$1,357 (Avg $/SQFT)
16 (Avg DOM)
Sold
0 (Number of Properties)
$1,725,000 (Avg Price)
$1,157 (Avg $/SQFT)
26 (Avg DOM)
96% (% of Avg Sold Price/Avg List Price)
Burlingame Park (30-day trend)
 
Number of Properties
Avg Price
Avg $/SQFT
Avg DOM
% of Avg Sold Price/Avg List Price
Active
3 (Number of Properties)
$3,928,200 (Avg Price)
$1,403 (Avg $/SQFT)
92 (Avg DOM)
Sold
1 (Number of Properties)
$1,942,394 (Avg Price)
$1,075 (Avg $/SQFT)
66 (Avg DOM)
99% (% of Avg Sold Price/Avg List Price)
Burlingame Terrace-Easton Additi (30-day trend)
 
Number of Properties
Avg Price
Avg $/SQFT
Avg DOM
% of Avg Sold Price/Avg List Price
Active
3 (Number of Properties)
$2,875,962 (Avg Price)
$1,374 (Avg $/SQFT)
20 (Avg DOM)
Sold
3 (Number of Properties)
$1,633,692 (Avg Price)
$1,157 (Avg $/SQFT)
38 (Avg DOM)
100% (% of Avg Sold Price/Avg List Price)
Burlingame Village (30-day trend)
 
Number of Properties
Avg Price
Avg $/SQFT
Avg DOM
% of Avg Sold Price/Avg List Price
Active
0 (Number of Properties)
$1,893,975 (Avg Price)
$1,588 (Avg $/SQFT)
4 (Avg DOM)
Sold
0 (Number of Properties)
$0 (Avg Price)
$0 (Avg $/SQFT)
0 (Avg DOM)
0% (% of Avg Sold Price/Avg List Price)
Burlinhome / Easton Add #2, #3, (30-day trend)
 
Number of Properties
Avg Price
Avg $/SQFT
Avg DOM
% of Avg Sold Price/Avg List Price
Active
3 (Number of Properties)
$4,194,934 (Avg Price)
$1,398 (Avg $/SQFT)
25 (Avg DOM)
Sold
1 (Number of Properties)
$3,372,985 (Avg Price)
$1,340 (Avg $/SQFT)
27 (Avg DOM)
103% (% of Avg Sold Price/Avg List Price)
Lyon-Hoag (30-day trend)
 
Number of Properties
Avg Price
Avg $/SQFT
Avg DOM
% of Avg Sold Price/Avg List Price
Active
1 (Number of Properties)
$3,999,999 (Avg Price)
$1,738 (Avg $/SQFT)
20 (Avg DOM)
Sold
2 (Number of Properties)
$1,638,709 (Avg Price)
$983 (Avg $/SQFT)
35 (Avg DOM)
106% (% of Avg Sold Price/Avg List Price)
Mills Estates (30-day trend)
 
Number of Properties
Avg Price
Avg $/SQFT
Avg DOM
% of Avg Sold Price/Avg List Price
Active
2 (Number of Properties)
$3,706,453 (Avg Price)
$1,380 (Avg $/SQFT)
72 (Avg DOM)
Sold
0 (Number of Properties)
$3,100,000 (Avg Price)
$1,225 (Avg $/SQFT)
34 (Avg DOM)
100% (% of Avg Sold Price/Avg List Price)
Oak Grove Manor / Burlingables (30-day trend)
 
Number of Properties
Avg Price
Avg $/SQFT
Avg DOM
% of Avg Sold Price/Avg List Price
Active
0 (Number of Properties)
$0 (Avg Price)
$0 (Avg $/SQFT)
0 (Avg DOM)
Sold
1 (Number of Properties)
$3,080,600 (Avg Price)
$1,601 (Avg $/SQFT)
35 (Avg DOM)
104% (% of Avg Sold Price/Avg List Price)
Ray Park (30-day trend)
 
Number of Properties
Avg Price
Avg $/SQFT
Avg DOM
% of Avg Sold Price/Avg List Price
Active
1 (Number of Properties)
$3,350,000 (Avg Price)
$1,572 (Avg $/SQFT)
2 (Avg DOM)
Sold
1 (Number of Properties)
$4,423,064 (Avg Price)
$1,513 (Avg $/SQFT)
27 (Avg DOM)
103% (% of Avg Sold Price/Avg List Price)

Property Info